A BTC drop to $56,625 could be on the horizon, according to OANDA analysis. BTC could drop 75% from its all-time high, if it follows past patterns. Bitcoin (BTC) has been sideways around $67,000 (USD) for three weeks. This movement occurs after falling to 60,000 on February 6, 2026, 52% below its all-time high of 126,000 marked on October 6, 2025. However, in this tense calm, the possibility of lower prices in the short term remains latent. “The $70,000 wall and technical break point to further decline,” said Zain Vawda, market analyst at MarketPulse, an analysis service of trading company OANDA. Bitcoin has repeatedly rejected that level, while macro and technical factors reinforce the bearish bias, he explained in a report published on February 18. The asset has attempted to consolidate above $70,000 three times since February 5, but each advance was followed by selling pressure. In this context, the digital currency moves mostly between $67,000 and $68,000, with a drop of close to 28% during February. From a technical analysis point of view, Vawda observes the formation of a symmetrical triangle in the price of bitcoin that broke down. This figure is composed of an ascending support line, reflecting higher lows from the $60,000 bounce. And it is completed with a descending resistance line formed by lower highs. In other words, the price is being compressed within a narrow range. As the following chart shows, the price broke through the lower zone of the triangle and the 50-day simple moving average. If it holds below, this would confirm a bearish breakout, says the analyst. Consequently, sees the next relevant support at $65,000, $60,000 or $56,625depending on the level of selling pressure.
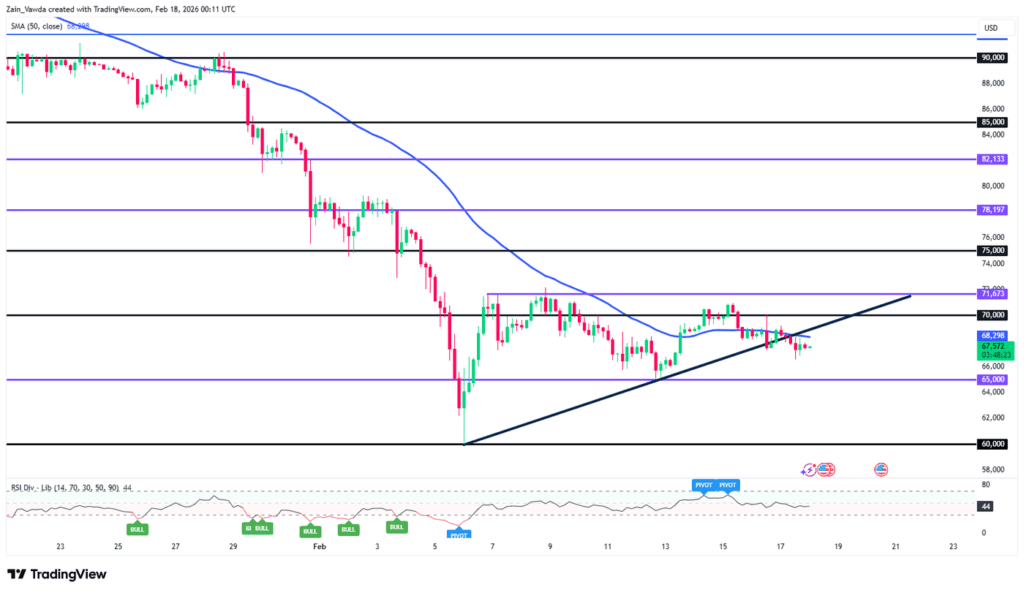 Bitcoin broke down the trend of higher lows of the triangle (black line) and the 50-day moving average (blue line). Source: Seeking Alpha. If this turns out to be a «false exit» and the price rises again and breaks the upper resistance of the triangle, the bullish targets could be near $80,000, the specialist noted.
A context marked by negative catalysts
According to Vawda, the market faces a set of negative catalysts that range from geopolitical tension to regulatory obstacles and pressures on companies with treasuries in bitcoin. It mentions, in this sense, that the increase in global conflicts promoted an environment of risk aversion, in which investors migrate towards traditional assets considered refuge. Under these conditions, bitcoin shows a behavior closer to that of risk assets than to gold. This outlook has been driven by US President Donald Trump’s tariff threats. The president seeks to get other governments to accept his plans, including that of buying Greenland. In turn, this is intensified by the war conflicts that continue in the Middle East and Ukraine. to it legislative stagnation in the United States regarding the so-called Clarity Law adds up. For months, the sector had hoped this framework would offer greater regulatory certainty, but recent delays have weakened institutional optimism and reduced buying momentum. Meanwhile, companies with bitcoin treasury strategies face pressure from the asset’s depreciation. Strategy recently added 2,486 BTC at an average price of $67,710, raising its reserves to more than 717,000 BTC, although with operating losses due to the current price. For its part, Metaplanet reported a drop of approximately $665 million in the valuation of its holdings. The panorama also shows exits in bitcoin exchange-traded funds (ETFs) and a rotation of capital towards sectors linked to artificial intelligence, which contributes to the outflow of liquidity from the market.
Bitcoin ETFs and derivatives in the spotlight
Bitcoin spot ETFs have had four consecutive weeks of capital withdrawals, which affects the price of the asset. This is because management companies buy or sell BTC according to the supply or demand of their shares. «If this trend [de retiros] continues, the asset could face additional downward pressure in the short term,” said Carolina Gama of Bitget, country manager of the Bitget cryptocurrency exchange, in a statement sent to BitcoinDynamic on February 18.
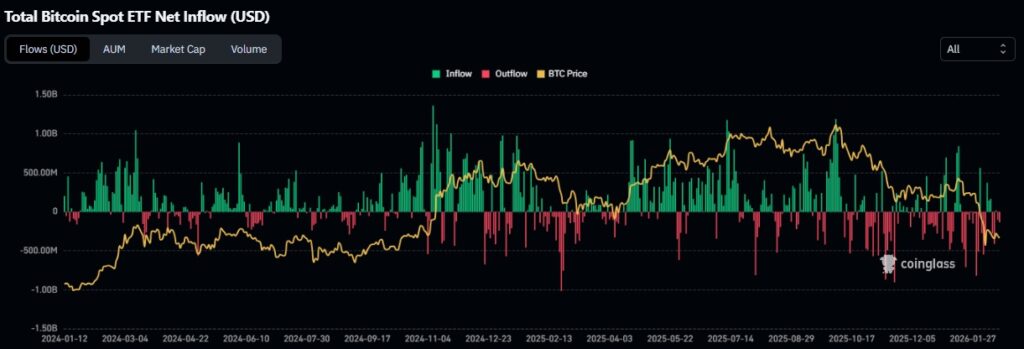 Although there are days of capital inflows (green), outflows in bitcoin ETFs (red) are predominating. Source: Coinglass. The directive added that, in the derivatives market, the reduction in open interest below 260,000 BTC – the lowest level since October – indicates that investors have reduced their bullish positions. However, he pointed out that, with fewer open positions, the probability of marked fluctuations in the short term decreases. In terms of technical levels, according to Gama, a daily close below $65,729 could open space for a test of support at $60,000. On the other hand, it considers that a break above $71,746 would reinforce the recovery scenario, with the possibility of advancing towards the $73,072 area.
Bitcoin is under an important price level
Amid the weakness shown by the market, bitcoin remains below a relevant level: the real market average, located near $79,000. This indicator calculates the average acquisition cost of active investors and is usually interpreted as a market equilibrium point. According to the analysis firm Glassnode, the asset is thus located between two key valuation references. On the one hand, the real market average is positioned as potential resistance in an increase. On the other hand, realized price acts as possible structural lower limit around $54,900clarifies the analysis firm. The realized price represents the average acquisition cost of all bitcoins in circulation, according to the price of their last movement on the network. This metric allows us to approximate the level at which the market as a whole maintains its investment.
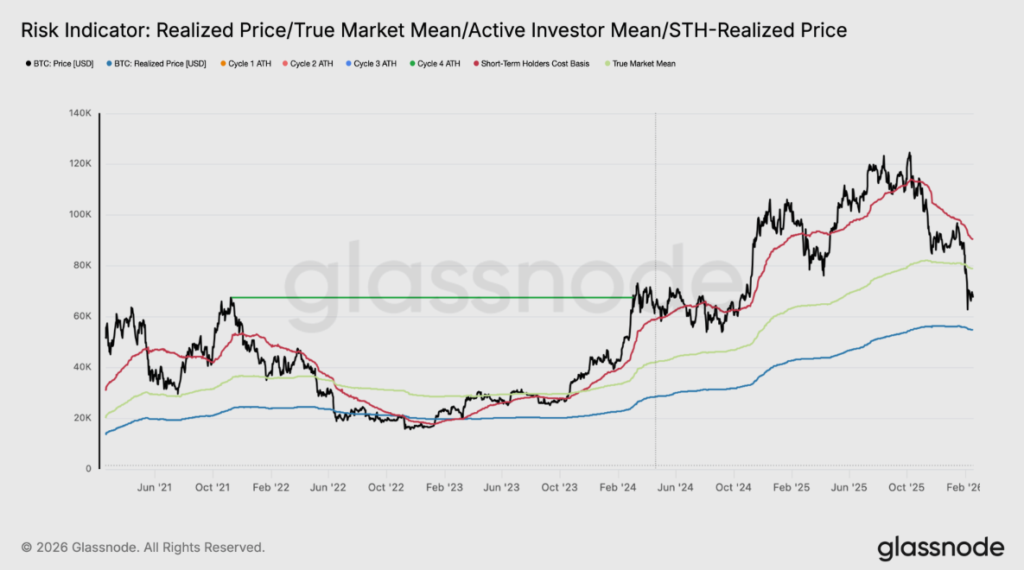 The price of bitcoin is shown in black, the cost base of short-term holders in red, the real market average in green, and the realized price of bitcoin in blue. Source: Glassnode. Glassnode noted that, Without a relevant macroeconomic catalyst, the range between such levels is likely to delimit behavior. of bitcoin in the medium term. Among the expected signs, they mentioned an improvement in liquidity. Something that enables greater liquidity in the economy are expectations of interest rate cuts in the United States. The mandate of Jerome Powell, the current director of the Federal Reserve, ends in May, which motivates such expectations. However, there are still no clear signals about the monetary policy that will follow, which maintains uncertainty. For analysts like Willy Woo, bitcoin is beginning a bearish phase associated with the contraction of global liquidity. In this sense, expect this behavior to extend to stock markets and the digital currency pushes lower prices. Bitcoin’s fall since October is in correlation with software stocks, due to uncertainty about the impact of artificial intelligence (AI). There are fears that this technology could make traditional models obsolete. Although, at the same time, there are concerns about a possible bubble around AI, amid fears that its capabilities are overvalued. In contrast, the S&P 500, which tracks stocks of prominent companies in various sectors, shows divergent behavior. At the end of January, it set new all-time highs, continuing with an upward trend that has been going on for three years and that could be about to endaccording to Woo.
A bear market that could extend
The bearish outlook matches a historical pattern that bitcoin has had. It always came to the end of a bullish cycle the year after each halving and then had a drop of around 80%. In any case, the percentage of such correction has decreased slightly in each cycle. In the crypto winter that occurred in 2014, it registered a drop of 86%, in 2018 83% and in 2022 77%. According to such a movement, bitcoin, which reached a record in 2025, the year after its most recent halving, could continue to decline. Based on its past performance, it could fall around 75% from its all-time high. That means the possibility that this crypto winter find bottom around $31,000as the next graph shows.
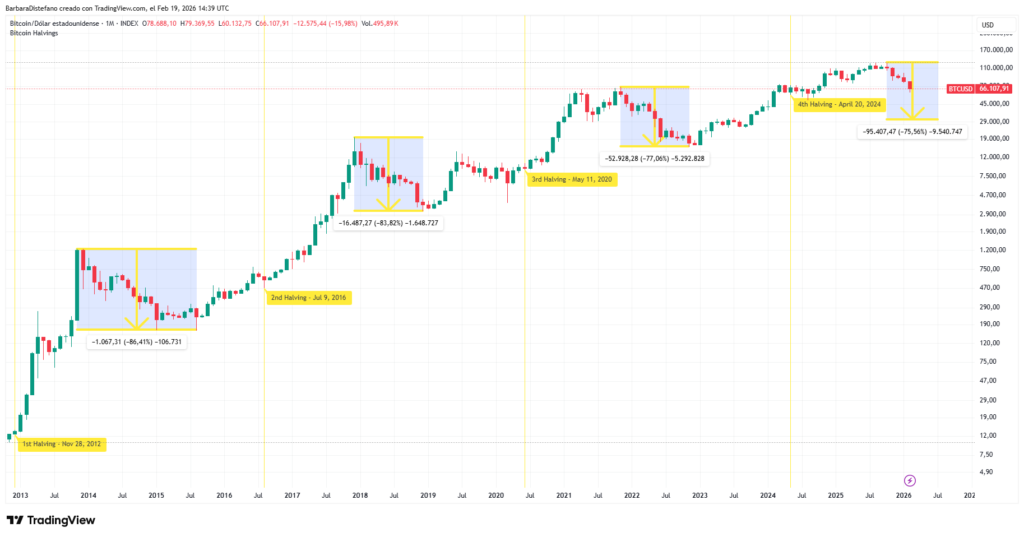 Bitcoin could have a drop of around 75% if it maintains its historical correction pattern. Source: TradingView. In the end, whether or not lower prices are granted will depend on market supply and demand. Therefore, as with any asset, it is crucial to have a risk plan in place to avoid unwanted scenarios. As Ulises Mendieta, human capital specialist at BitcoinDynamic and psychologist with experience in psychotrading, said, «the appropriate attitude in these scenarios is the combination of calm, discipline of the investment plan and long-term perspective.»