The cryptocurrency market lost $1.16 trillion in capitalization since January 14. The cost of mining 1 BTC is USD 58,740, which could be considered a floor for the price. In recent months, a disturbing narrative has gained unusual strength in global financial circles: the idea that Bitcoin is no longer a scarce asset because Wall Street Has Finally Learned How to “Make Synthetic Supply” through complex derivative instruments. According to this vision, the massive proliferation of ETFs, futures markets and structured notes would have transformed Bitcoin into a manipulable market, where the price no longer responds to the scarcity of the real asset on the chain, but to the strategic management of inventories by large financial institutions. This thesis is both seductive and dangerous, especially after observing the technical violence of recent weeks, where the cryptocurrency market has lost approximately $1.16 trillion in market capitalization since last January 14.
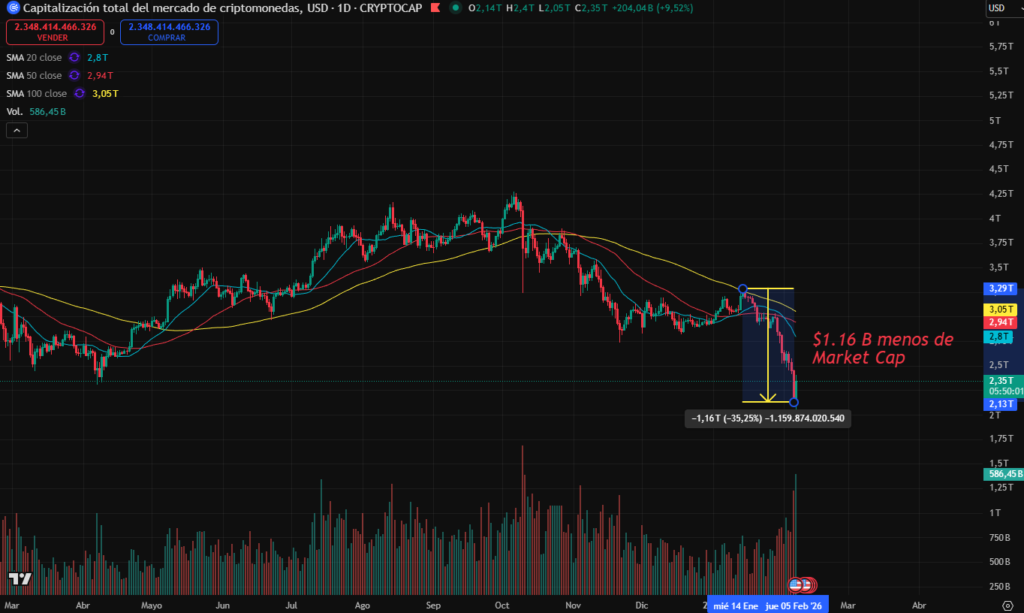 In just over two weeks, the market lost this enormous sum of money. Source: TradingView. However, this interpretation confuses the transitory mechanics of the price with the immutable nature of the underlying asset. The protocol continues to issue blocks every 10 minutes and the limit of 21 million is unchanged. What we are experiencing is not the death of scarcity, but an aggressive reconfiguration of who has the most influence over the price.
The difference between “Supply” and “Promises”: The Derivatives Trap
The spot is the price of the real asset (Bitcoin on-chain). Derivatives (futures, perpetual swaps, options, ETFs) are contracts based on the underlying, but can be created in unlimited volumes (synthetic «paper»). It is undeniable that Wall Street has built an unprecedented derivatives architecture on top of Bitcoin. In this new paradigm, the traditional financial system has achieved that a 1 BTC on-chain real estate can simultaneously support multiple off-chain financial products. A unit of ETFs for the institutional investor. A contract of futures
The delta of a option. A perpetual swap for speculation. A loan from a broker using BTC as collateral. A structured note of leveraged debt. In essence, they are tools designed so that traditional capital can bet for or against the price, without necessarily owning the actual asset. It is essential to understand that today Bitcoin trading is dominated by approximately 80% for the futures market. We can notice this in the following table:
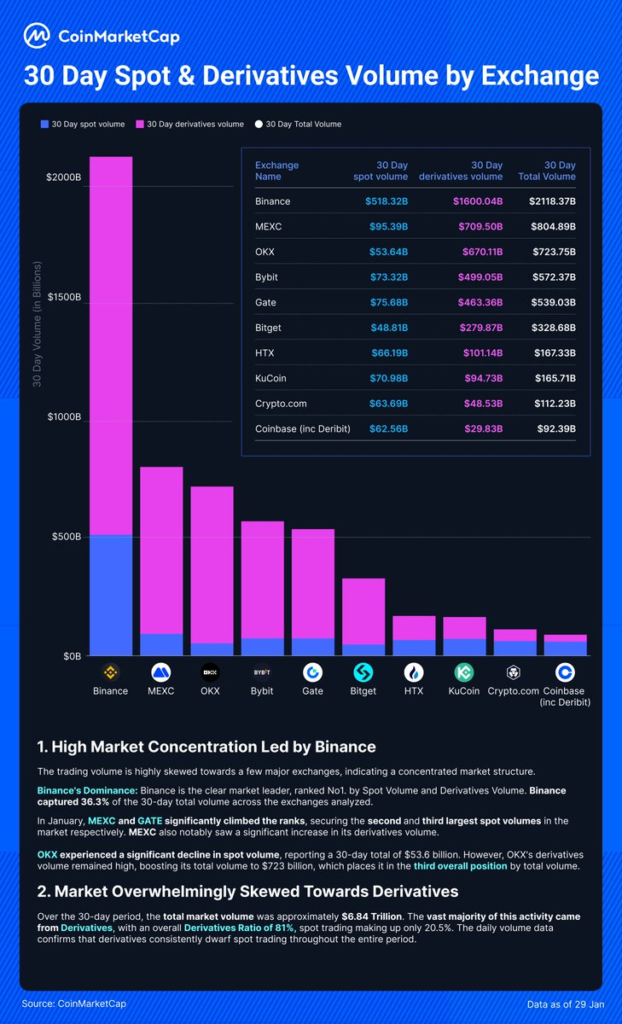 The majority of futures volume is currently traded on Binance. Source: CoinMarketCap. This dynamic alters the perception of scarcity and price formation. It is important to highlight price discovery, which is the process by which markets incorporate new information into prices. There are studies that argue that derivatives lead price discovery. For example: A 2020 analysis (updated in 2025 papers) finds that perpetual swaps and futures on unregulated exchanges (Huobi, OKEx, BitMEX) contribute >60% to price discovery, while spot (Coinbase, Bitstamp) and regulated futures (CME) react with a lag. Granger causality tests: BTC futures Granger cause spot (ie, changes in futures predict spot, not the other way around). In daily data from 2017-2019 (extended to 2025), episodes where futures lead for months, with occasional bidirectionality, but derivatives dominate. On the other hand, it is also worth highlighting that derivatives amplify movements. The funding rate is a rate in perpetual futures designed to align the contract price with the spot price. A high, positive funding rate indicates strong bullish sentiment and anticipates price increases as longs pay fees to shorts. And vice versa. We saw this effect in the crash of 10/10 2025. By the beginning of October 2025 the funding rate had gone from 10 to 30% and up to 40% according to VanEck. This signaled extreme bullish overleverage and acted as a red warning of overcrowding on longs. That’s why mass liquidations arose. In short, the massive volume in synthetic instruments generates volatility induced by forced liquidations, where the «paper» ends up dragging down the spot price, regardless of the mathematical scarcity of the protocol.
The “mildest” bear market in history: Data vs. Narratives
Bitcoin is navigating areas of critical historical definition, below the all-time high of the 2021 cycle, which was USD 69,800. However, when analyzing the cold data from February 2026, we are looking at the mildest bear market in history in terms of percentage drawdown:
2013-2015 Cycle: Devastating fall of 93%.
2017-2018 Cycle: Retraction of 84%.
2021-2022 Cycle: Fall of 77%.
Current Cycle (2025-2026): 50% is approximately the accumulated fall compared to the maximum of USD 126,296 last October. This phenomenon is explained by unprecedented institutional retention. At the beginning of February 2026, the US Spot Bitcoin ETF They own around 1.28 million BTCa figure that is barely a 5-6% below its all-time high.
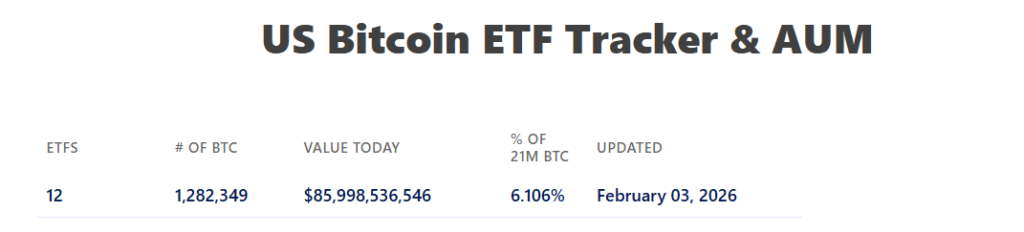 Spot ETFs still hold 6% of supply. Source: Bitbo. This means that the 94-95% of institutional hodlers They are holding firm despite a near 50% price drop from BTC’s peak and sustaining a temporary 25% loss from their average purchase price of $90,000.
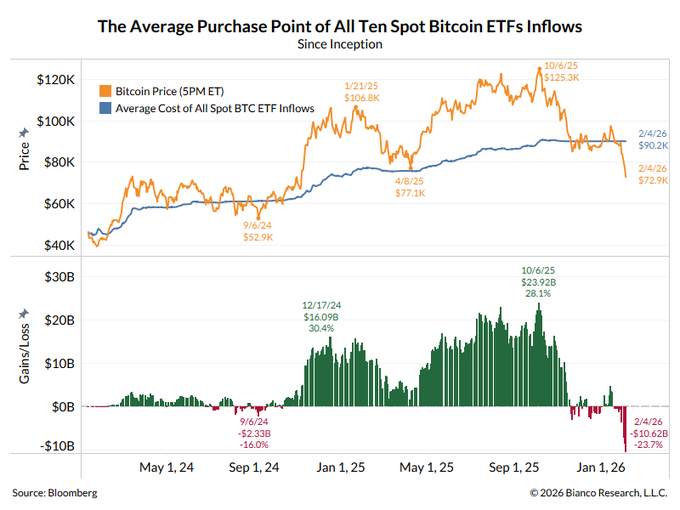 The ETFs are 23% below their average buy and still maintain their positions. Source: Bloomberg. Both The “Four Horsemen” and other large traditional players have gone from being spectators to structural accumulators that absorb the supply that the retailer releases in panic. What was previously a vertical collapse of 80% is today a correction (for now milder) where institutions use derivatives to manage their entry at discounted prices. This Wall Street tactic is known as Shakeout, and it is where the derivatives market acts as the main engine for the transfer of wealth. This dynamic begins with manufacturing outflow liquidity, where institutions often amplify fear or use forced liquidation events like the one mentioned above, to force retail investors to panic sell. Such a sell-off creates the liquidity needed for large institutions to buy huge volumes at discounted prices before the market recovers.
The Bitcoin Electric Wall
A determining factor that sustains the current structure is the real production cost. Historically, the price of Bitcoin has demonstrated a near-total inability to stay below its electrical cost on a sustained basis.
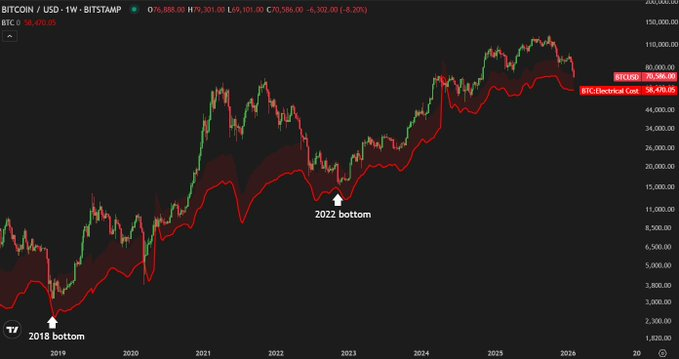 The cost of mining a bitcoin can be the definitive price floor. Source: TradingView. At the beginning of February 2026, the Current Electricity Cost stands at USD 58,740. This value is the minimum energy expenditure to secure the network. When the price approaches this “electrical floor,” it stops falling and a natural supply restriction occurs: miners turn off inefficient machines and stop selling their coins to avoid operational losses, creating a last resort support that reaffirms that Bitcoin is pure physical energy converted into immutable value.
The glass market versus the steel protocol
Attributing volatility to “scarcity is dead” is a superficial read. The financial ecosystem surrounding Bitcoin—with its maneuvering and excessive leverage—can behave like a “glass castle” prone to exploding at any tweet or coordinated event. However, the Bitcoin protocol remains indifferent. Bitcoin does not change its essence: when the price falls, derivatives are sought to be blamed for having diluted its scarcity; but the reality is that verifiable scarcity on the blockchain remains intact. This cycle demonstrates that, despite paper volatility, Bitcoin continues to establish itself as the hardest reserve asset ever created.
Disclaimer: The views and opinions expressed in this article belong to its author and do not necessarily reflect those of BitcoinDynamic. The author’s opinion is for informational purposes and under no circumstances constitutes an investment recommendation or financial advice.