Ethereum reached almost 2.9 million daily transactions with fees less than USD 0.02. The increase in gas per block explains much of the phenomenon. Ethereum is going through an unusual situation in its history: the network is recording record levels of activity in its base layer (L1), while the fees paid by users remain at historic lows. As reported by BitcoinDynamic, on January 16, Ethereum processed about 2.9 million transactions in a single daythe largest historical record for the network. In parallel, while the number of daily operations has increased since mid-December last year, the total fees paid for using the protocol remain at exceptionally low levels. This, even with activity at maximums.
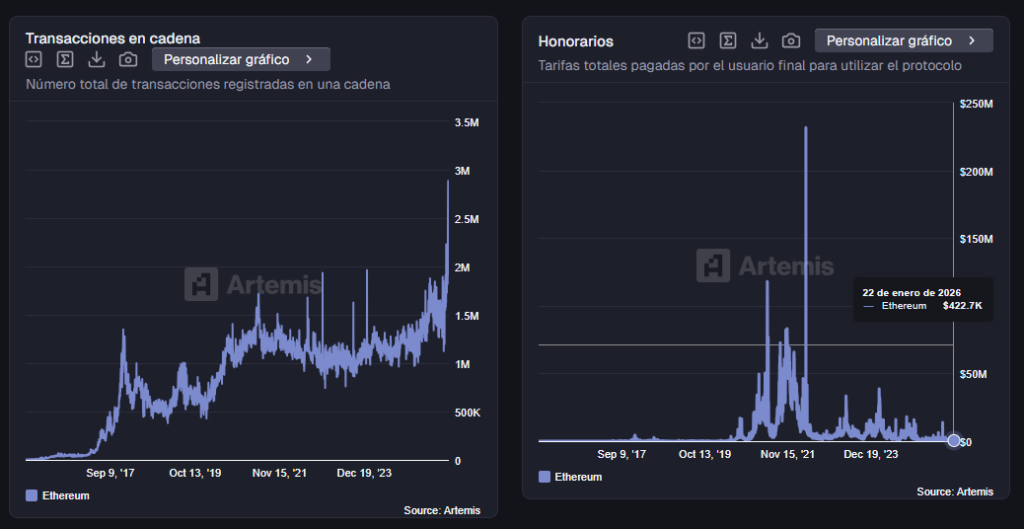 The number of operations in Ethereum increases and commissions remain at historic lows. Source: Artemis. Those statistics are confirmed by other analysis platforms such as Grow the Pie and DeFiLlama. Data from the Etherscan explorer reinforces the diagnosis of the drop in fees: at the time of writing this article, a simple transfer of ether (ETH) costs around USD 0.018.
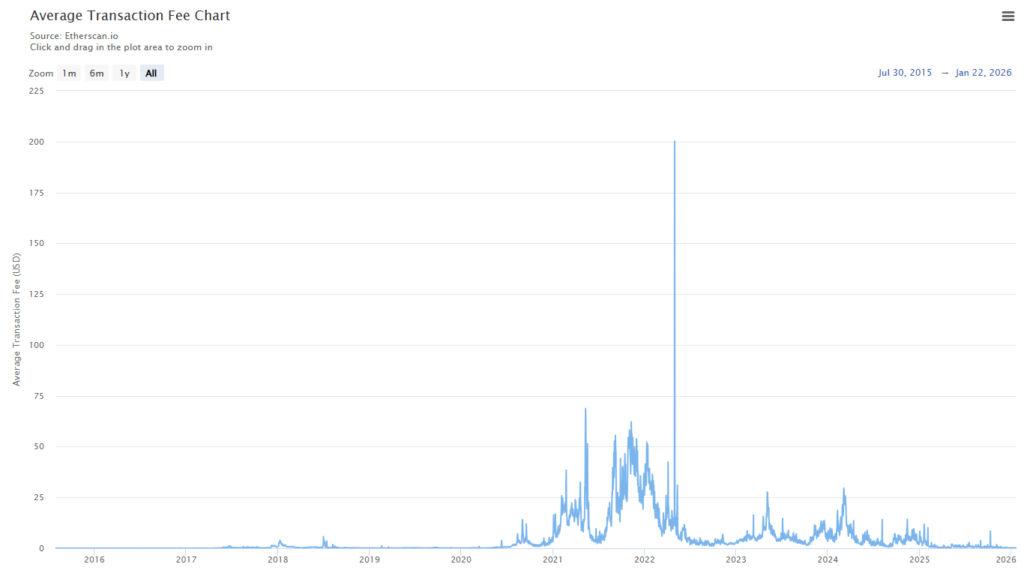 The fee in Ethereum for transferring ether is USD 0.018. Source: etherscan. Likewise, Ethereum’s throughput (the number of transactions the network can process in a period of time) reached all-time highs, reflecting greater operational capacity of the base layer. «In that context, on January 22 the base layer processed an average of 27.46 transactions per second (TPS), the highest level recorded so far. An indicator that has been on the rise since the beginning of January 2026. » On the other hand, since January 2026, active addresses in the base layer are also growing and are currently at all-time highs. With more than 1 million accounts as of January 23, this metrics grew 50% compared to the end of December. Something that is related to higher levels of adoption.
More transactions, fewer fees: the role of the gas limit per block
One of the main factors behind this behavior is the sustained increase in gas limit per block on Ethereum. A situation that was affirmed by Vitalik Buterin himself, as reported by BitcoinDynamic. Gas is the unit that measures how much computing each block can includeand works as a “maximum capacity” shared between all transactions. When the gas limit is low, users compete with each other to enter the next block, which increases fees. When that limit is extended, the block can include more operationsreducing congestion and pressure on fares. Since the beginning of 2025, this metric began to increase gradually. The process is not automatic: network validators agree They do accept blocks with more gas, but recent updates made that increase technically feasible without compromising stability. This is where the latest protocol improvements come into play. Following the Pectra and, in particular, Fusaka upgrade, the network can better tolerate an increase in the gas limit. Specifically, starting with the EIP-7935 proposal, included with Fusaka, Ethereum clients operate by default with a gas limit per block of 60 million.
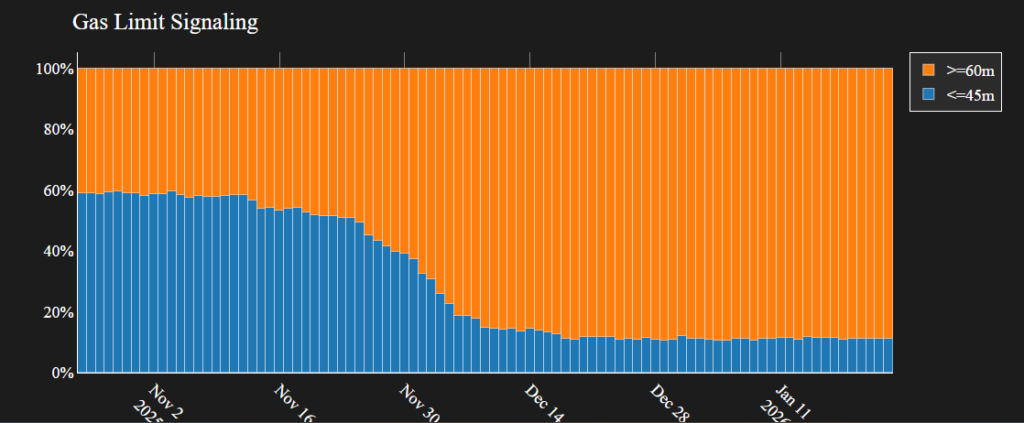 Ethereum increased the gas limit per block to 60 million. Source: Gaslimit. To put it in perspective: At the beginning of 2025, the effective limit was around 30 million gas. Today, that value has doubled to 60 million, which implies a growth of 100% in capacity per block. More capacity allows process more simultaneous transactions without users having to bid aggressively for space. This increase does not completely eliminate the fee market, but it does change its dynamics: with larger blocks, the network can absorb peaks of activity without fees skyrocketing as in previous cycles.
Other indicators reinforce Ethereum’s on-chain growth
The behavior of the commissions is not the only relevant data. Other metrics show that Ethereum’s growth goes beyond a one-time technical adjustment. Among the notable indicators:
Stablecoin volume: The network records all-time high levels in the use and circulation of stablecoins, reinforcing its role as a base financial infrastructure.
ETH Staking: The amount of ether deposited in the validation mechanism is also at unprecedented highs, a sign of medium or long-term confidence in the network.
Relative activity between layers– According to January 22 data from Token Terminal, there are currently more active accounts in the base layer (L1) than in second layer (L2) solutions, a trend that had been reversed for much of 2024 and 2025. This last point deserves caution. This is a recent phenomenon and could be circumstantial, influenced by temporary changes in costs, incentives or usage patterns. Its persistence can only be evaluated over time. Taken together, the data shows Ethereum in a stage of greater structural efficiency: more transactions, less economic friction and a network that, at least for now, manages to scale without passing the cost on to the end user.